Cutting Through Auto Industry Hype: How to Read Research Like a Pro
Learning to spot bias and marketing spin in automotive market reports

Every quarter, new automotive industry reports land in inboxes promising to reveal the future of mobility, EV adoption, autonomous driving timelines, and supply chain restructuring.
Most of these reports are legitimate research. Some are marketing dressed up as analysis.
The trick isn't dismissing industry research entirely—it's knowing how to read it critically and separate insight from salesmanship.
Who Paid for the Research?
The first question to ask is always: who funded this study?
A report sponsored by a battery manufacturer will naturally emphasize EV infrastructure readiness. A consulting firm hired by a legacy automaker might highlight slowdowns in EV transition timelines.
Sponsorship doesn't automatically invalidate findings, but it tells you where the research started. Look for a disclosure statement buried near the end—or note its absence, which is itself a red flag.
Industry associations often publish joint research that represents a consensus view. That's valuable, but it's also inherently conservative.
Traits That Signal Credible vs. Promotional Research
Strengths
- Cites primary data sources and explains how the sample was selected
- Acknowledges limitations and competing interpretations
- Includes methodology footnotes or a separate technical appendix
- Cites prior work by other organizations, not just the sponsor's past reports
- Presents unflattering findings alongside optimistic ones
Trade-offs
- Leads with a press release instead of letting data speak first
- Uses superlatives ('unprecedented', 'revolutionary') in headlines
- Buries sample size or respondent details; vague on 'how many'
- Cites only studies that support its main claim
- Lacks any acknowledgment of uncertainty or alternative scenarios
Sample Size and Sampling Bias Matter More Than You'd Think
A report based on 50 interviews with executives carries less weight than one polling 5,000 vehicle owners across multiple demographics.
Pay attention to who was surveyed. Industry executives have different priorities than consumers. Fleet managers see the world differently than individual buyers.
A study of early EV adopters will naturally show stronger enthusiasm for electrification than a broader population sample. That's not fraud—it's selection bias built into the research design.
Good reports disclose this. They'll say 'we surveyed 800 U.S. consumers with household income above $75k' or 'interviewed 40 supply-chain directors at Tier 1 suppliers.' Vague language like 'market participants' or 'key stakeholders' is a warning sign.
Extrapolation Traps: When Short-Term Data Predicts the Future
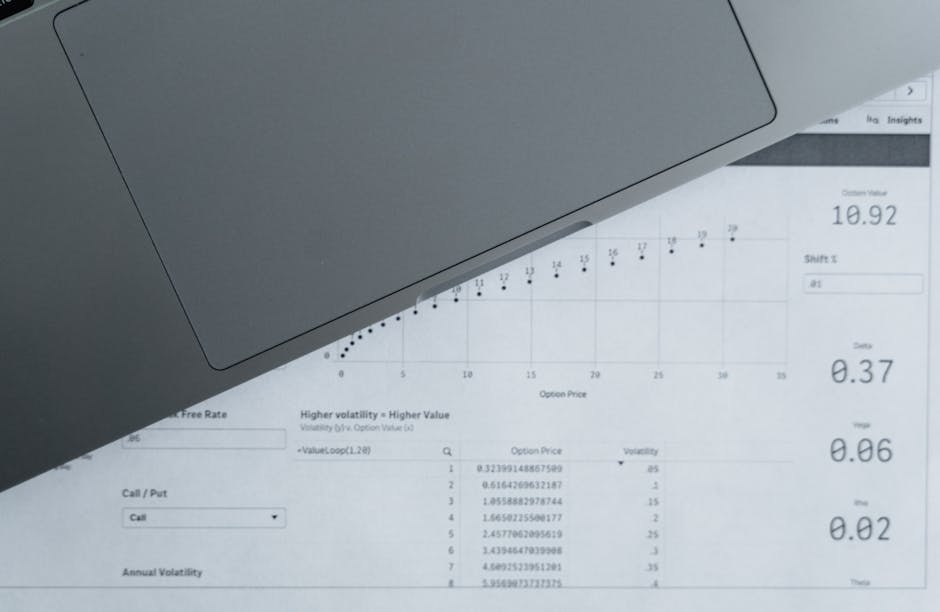
One of the easiest ways to oversell a finding is to extend a narrow trend across decades.
EV sales jumped 50% in 2023, so a report might project that trajectory out to 2035. That looks alarming or exciting depending on your stance—but it assumes no policy changes, no economic downturns, no competing technologies, and no shifts in
consumer behavior.
Look for sensitivity analysis in serious research. Good reports will show: 'If growth slows to 20% annually instead of 50%, the market reaches 40% penetration by 2035 instead of 70%.' They build in scenarios.
If a report shows only one forecast line, treat it as a single plausible scenario, not destiny.
The Confidence Interval Isn't Just Academic Filler
When research reports a finding—'75% of fleet managers plan to electrify by 2030'—a credible source includes a margin of error.
That 75% might actually be anywhere from 68% to 82% depending on how the survey was run. Or it might be plus or minus 5 percentage points in either direction.
Reports that omit confidence intervals or error bars are either poorly designed or deliberately inflating certainty. NIST and other technical standards bodies emphasize this for good reason—uncertainty is honest.
If you see a claim without a stated range, ask yourself: would I make a major business decision based on a single number with no bounds?

Five Questions to Ask Before You Trust a Report
1. Who funded or commissioned this research? — Disclosure of sponsor reveals potential bias direction.
2. How many people or data points were analyzed? — Sample size of 100 tells you less than 10,000. Vagueness is suspicious.
3. What was the exact research question and methodology? — A detailed methods section shows the authors have nothing to hide.
4. Are alternative explanations or limitations acknowledged? — Self-aware research is more credible than absolutist claims.
5. When was this data collected, and how recent is the analysis? — A 2024 report on 2020 survey data may miss 2025 shifts in the market.
Industry Consensus vs. Contrarian Takes
In 2026, you'll encounter two broad categories of auto research: consensus (EV adoption will accelerate, autonomous vehicles will eventually scale) and contrarian (legacy OEMs won't cede the market, cost barriers will slow EVs more than expected).
Neither is automatically true or false. Both types of research have legitimate versions and hype-driven versions.
The contrarian research has an incentive to be sensational—disagreeing with consensus gets attention. Watch for this bias just as carefully as you'd watch for tech-utopian cheerleading.
Use multiple sources that span both camps, then look for where the evidence overlaps. That's often where the real insight lives.